Overlay Overload: Examining Real-Time Statistics Displays' Effects on Amateur Team Preparation Routines
Blake Reed · Aug 16, 2026
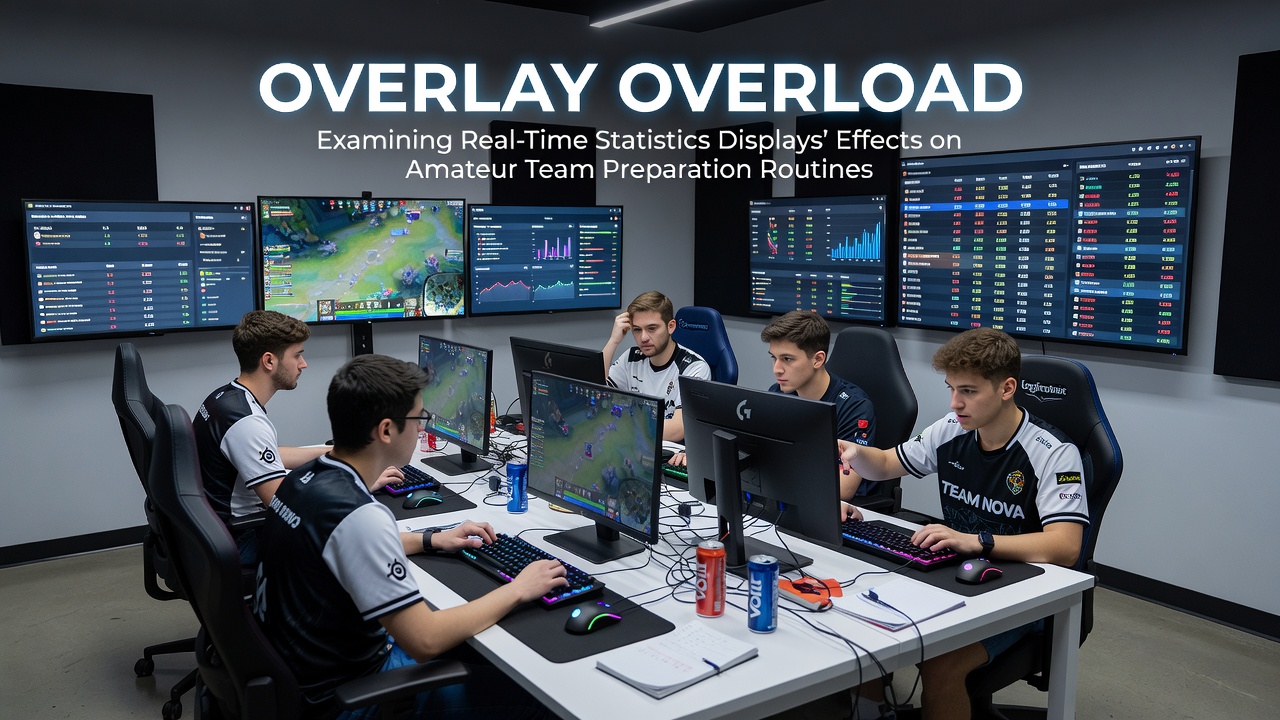
Overlay Overload: Examining Real-Time Statistics Displays' Effects on Amateur Team Preparation Routines
Real-time statistics overlays have become standard tools in amateur esports preparation, where teams integrate live data feeds showing metrics like damage per minute, positioning heatmaps, and resource efficiency during scrimmages and review sessions. These displays pull information directly from game APIs and third-party trackers, allowing players to monitor performance without pausing gameplay, while coaches adjust strategies on the fly based on visible patterns. In August 2026, several regional amateur leagues expanded their use of synchronized overlay systems across platforms, creating consistent data streams that teams access through shared dashboards.
Integration of Overlays into Daily Training
Amateur squads often begin preparation routines with baseline data pulls from previous matches, then layer in overlay configurations that highlight specific variables such as kill participation rates and vision control percentages. Teams set custom thresholds so alerts trigger when values dip below team averages, and this setup lets players drill targeted improvements during short practice blocks. Observers note that the process connects directly to post-game analysis, where recorded sessions replay with the same overlay elements active to reinforce visual recognition of key moments.
Cognitive Load and Decision Processing
Research indicates that simultaneous display of multiple statistics can increase cognitive demands during high-tempo phases of play. Studies from university labs have measured response times in controlled scrim environments and found that players processing five or more concurrent metrics show measurable delays in reaction compared to those limited to two or three core indicators. Data from the Entertainment Software Association reveals rising adoption rates of simplified overlay presets among North American amateur groups, where teams report trimming display elements after noticing patterns of distraction in early trials.
Yet the same datasets also document gains in long-term retention when overlays include historical comparison lines, allowing athletes to track progress against personal benchmarks without external reference materials. Those who've implemented tiered information systems, where core stats remain constant and secondary details fade in during pauses, observe steadier adaptation across multi-week training cycles.
Case Examples from Regional Leagues
One documented setup in European amateur circuits pairs overlay software with voice comms logs so that statistical spikes align with call timestamps, giving coaches concrete references for later debriefs. This method connects raw numbers to communication habits and has shown measurable shifts in how squads allocate in-game resources during subsequent sessions. Another instance from Australian development programs highlights teams that rotate overlay visibility, alternating full displays with stripped-down versions to test focus endurance over extended practice windows.
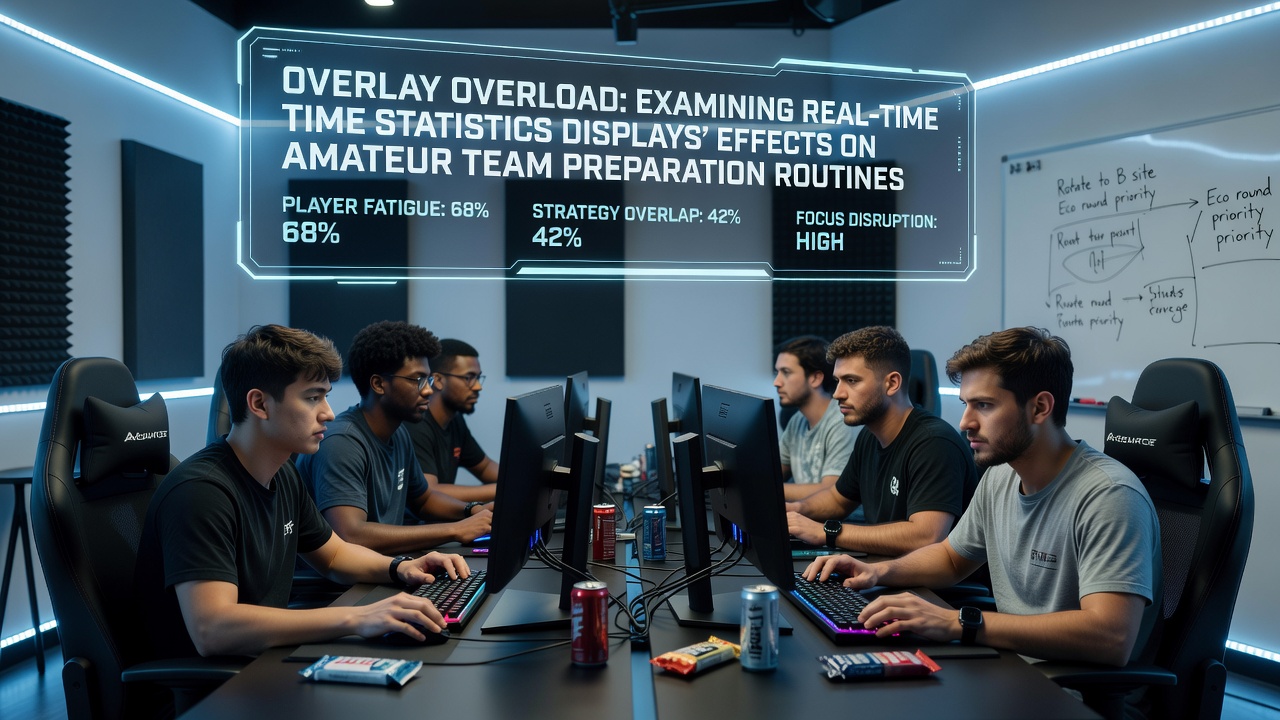
Figures from industry reports compiled by the European Games Developer Federation point to similar patterns across multiple titles, where preparation routines that incorporate controlled overlay exposure correlate with faster identification of recurring tactical errors. Teams that maintain logs of which metrics appear most frequently during review sessions tend to refine their dashboards iteratively, removing redundant elements while preserving those tied to measurable performance lifts.
Equipment and Software Considerations
Hardware setups for these systems range from single-monitor configurations with floating windows to multi-screen arrays that dedicate separate panels to live feeds and historical graphs. Software compatibility issues surface when patches alter API outputs, forcing amateur groups to update scripts and retest overlay accuracy before major tournaments. The process involves cross-checking data against official game servers to confirm synchronization, and leagues in 2026 have begun issuing standardized calibration guidelines to reduce discrepancies between squads.
Training logs kept by several clubs show that overlay calibration time occupies roughly fifteen percent of total preparation hours, yet the investment yields consistent access to granular feedback that manual note-taking cannot replicate at the same speed. Players accustomed to the displays describe quicker recognition of momentum shifts once the visual language becomes familiar through repetition.
Conclusion
Overlay systems continue to shape how amateur teams structure their preparation by supplying immediate visual access to performance variables that once required separate review tools. Continued data collection from league organizers and academic partners tracks both the processing demands and the efficiency gains that emerge when displays align with specific training objectives. As platforms refine API access and teams refine their configurations, the routines surrounding these tools remain central to preparation across competitive levels.