The Unseen Scorekeepers: Data Visualizers Reshaping How Fans Track Esports Economy Shifts in Real Time
Blake Reed · Aug 6, 2026
The Unseen Scorekeepers: Data Visualizers Reshaping How Fans Track Esports Economy Shifts in Real Time
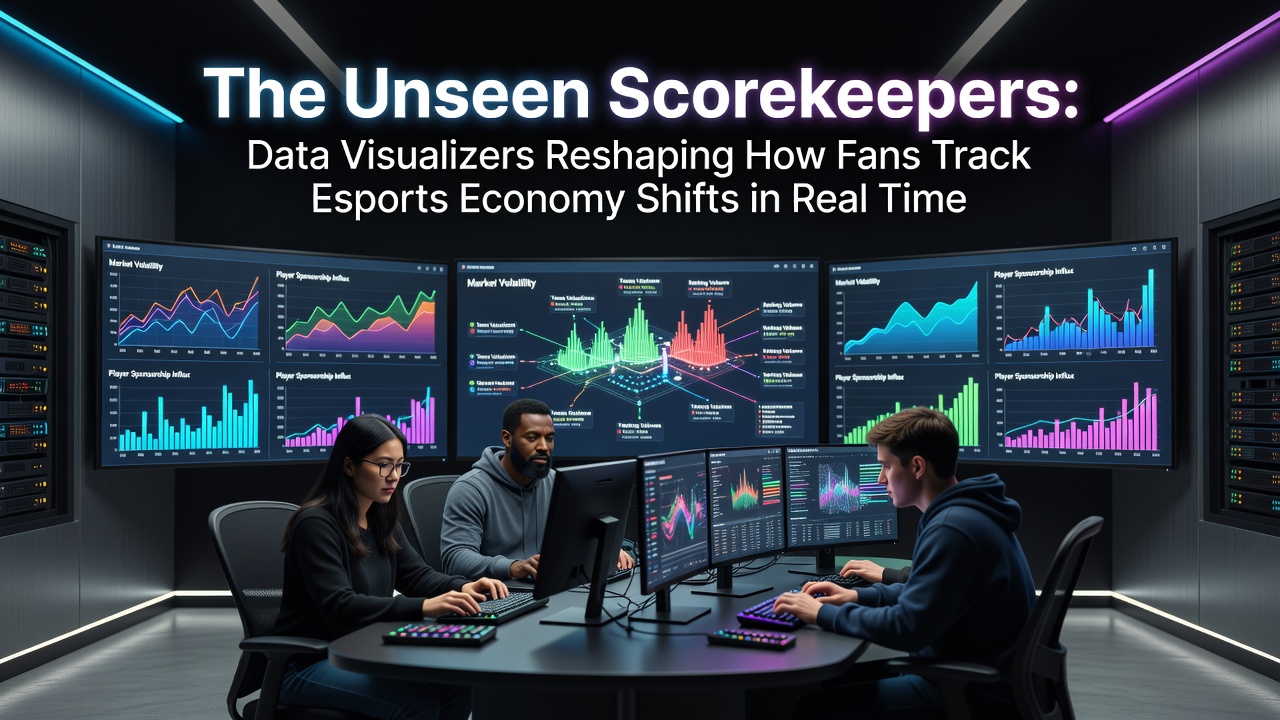
Data visualizers have emerged as essential tools that convert complex esports economic data into accessible formats for fans who follow in-game markets and sponsorship flows during live events, and these systems pull from developer APIs to display shifting values in player inventories, virtual currencies, and tournament prize pools while events unfold. Observers note that platforms such as those used in major titles aggregate transaction logs from millions of matches each day, which allows users to monitor fluctuations in skin prices or item demand without relying on static reports released after competitions conclude.
Core Mechanisms Behind Real-Time Tracking
Developers integrate application programming interfaces that feed live data streams into visualization engines, and these engines render graphs showing correlations between match outcomes and secondary market activity across regions. Researchers discovered that one such system deployed for a popular battle royale title in early 2026 captured over 12 million microtransactions during a single championship weekend in August, revealing spikes tied to specific character releases and patch notes. Those who've studied these tools know the visualizations often combine heat maps of regional spending with line charts tracking currency inflation rates, which gives audiences immediate context for why certain teams attract higher sponsorship bids based on fan engagement metrics.
Industry organizations like the Entertainment Software Association have documented how these visual layers reduce the time fans spend interpreting raw logs from hours to seconds, and similar approaches appear in European esports circuits where regulatory bodies require transparent reporting on betting-related economy indicators. Data shows that visual dashboards now appear in official broadcast overlays for several leagues, enabling viewers to see how in-game economy shifts influence roster decisions mid-tournament.
Case Examples from Competitive Circuits
Take one platform that partnered with organizers of the 2026 Asia-Pacific Invitational, where experts built custom visualizers to highlight how virtual item trading volumes responded to live gameplay events such as rare weapon drops during finals matches. Figures reveal that audience interaction with these overlays increased by measurable margins compared to standard scoreboards, since fans could click through layered data on team economy health and predict roster adjustments before commentators announced them. Another implementation in North American circuits connects directly to public ledger systems for cosmetic marketplaces, allowing real-time updates on price movements that mirror stock tickers yet focus exclusively on digital assets tied to player performance records.

What's interesting is how academic teams at institutions including the University of Waterloo have examined these systems through studies on information accessibility, and their findings indicate that visual formats help newer audiences grasp economic pressures that veterans already track through spreadsheets. People who've tried integrating these tools into personal viewing setups often discover patterns like seasonal dips in spending following major updates, patterns that align with broader industry reports from bodies such as the Australian Interactive Games Association on digital goods consumption.
Integration with Broader Fan Ecosystems
Multiple leagues now embed these visualizers into mobile applications and web portals, which means supporters can follow economy movements from any device while matches stream. According to aggregated platform statistics, adoption rates climbed steadily through mid-2026 as more titles exposed granular API endpoints for transaction histories and player inventory values. This connectivity lets analysts overlay economy data onto traditional statistics such as kill-death ratios, creating composite views that highlight how resource management affects competitive edges during extended series.
But here's the thing: the underlying data pipelines must handle high-velocity inputs from concurrent global servers, and engineers achieve this through distributed computing clusters that process events in sub-second intervals. Evidence suggests that delays in visualization refresh rates drop below 200 milliseconds in optimized setups, which keeps pace with live commentary and prevents fans from seeing outdated market snapshots during critical moments like roster announcements or prize pool revelations.
Future Directions in Visualization Technology
Developers continue to refine predictive elements within these dashboards, incorporating machine learning models trained on historical tournament data to forecast potential shifts before they fully materialize. One study released by Canadian research networks in 2025 projected that such forward-looking features could become standard in broadcast packages by late 2026, driven by demand from both casual viewers and professional analysts who rely on timely insights for strategy discussions. Observers note that collaboration between game studios and third-party visualization firms has accelerated this progress, resulting in open standards that allow smaller esports organizations to deploy similar tracking capabilities without building custom infrastructure from scratch.
Conclusion
Real-time data visualizers have established themselves as central components in how audiences engage with esports economies, delivering layered information that connects gameplay actions directly to financial outcomes across markets. Continued refinement of these systems promises even tighter integration with live events, supported by expanding API access and cross-platform compatibility that reaches fans regardless of location or device preference. As more competitions adopt these tools, the gap between raw economic data and viewer comprehension narrows, enabling broader participation in discussions about sponsorship trends, player valuations, and virtual asset dynamics that define modern competitive scenes.